Economy
Amsterdam Metropolitan Area Competitiveness within the Netherlands
The AMA's economy is one of the strongest Metropolitan Areas in the Euro Zone. From 2005-2010, the gross regional product (GRP) of the AMA grew significantly faster than other metropolitan regions in the EU27 group of metropolitan areas (2% growth for AMA and an average of 1.3% for other Euro Zone metropolitan areas).
The Amsterdam Economic Board is a partnership between government, industry, and knowledge institutions with the aim of determining economic development strategies for the Metropolitan Area. Data collected by the Board is used to predict an Economic Outlook for the region and also make suggestions for which industries should expand and where.
The Amsterdam Economic Board is a partnership between government, industry, and knowledge institutions with the aim of determining economic development strategies for the Metropolitan Area. Data collected by the Board is used to predict an Economic Outlook for the region and also make suggestions for which industries should expand and where.
|
The figure to the right is a representation of the AMA's GRP from 2001-2009 relative to the GDP of the Netherlands for 17 of its largest economic sectors. Larger circles represent sectors which make up a greater share of GDP. Sectors to the right of the Y-axis are more specialized in the AMA than in the rest of the Netherlands. Those sectors above the blue dashed line had higher than average growth. According to the figure, the AMA has a competitive advantage in the Financial Services, Wholesale, Information and Communication, and Transport and Storage sectors.
The Great Recession in 2009 hit the Netherlands particularly hard and recovery has been slow. The AMA fared about as well as the rest of the Netherlands, but scaled down consumer and business spending and a housing crisis hurt certain sectors differently. The basis of the AMA economy is particularly diverse and attractive to foreign investors; thus while some industries suffered particularly, some industries (non-commercial services, wholesale and exporting) helped buoy the economy and allowed it to rebound. Aviation, luxury goods, knowledge-intensive services, and construction among others suffered the worst. The total effect has been to narrow the economic basis of the AMA as the stronger industries expanded and others contracted. |
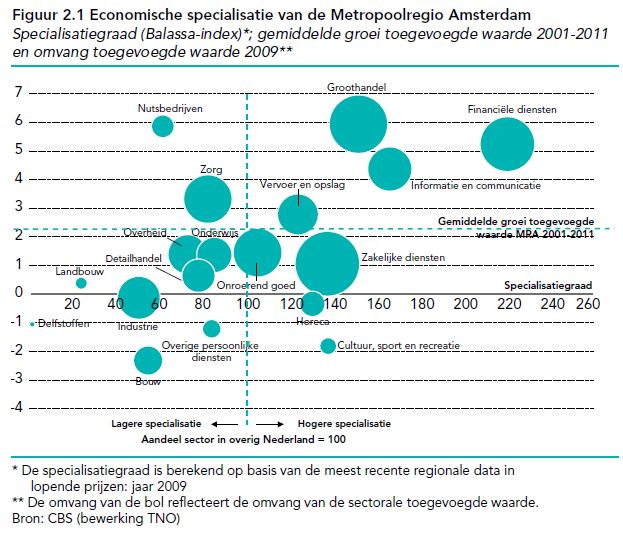
Figure 1: AMA key industries
1. Financiële diensten = Financial services
2. Informatie en communicatie = Information and communication
3. Groothandel = Wholesale
4. Cultuur, sport en recreatie = Culture, recreation and sport
5. Zakelijke diensten = Business services
6. Horeca = Food service industry
7. Vervoer en opslag = Transport and storage
7. Exploitatie onroerend goed = Operating property
8. Onderwijs = Education
9. Overige persoonlijke diensten = Other personal services
10. Zorg = Care
11. Detailhandel = Retail
12. Overheid = Government
13. Nutsbedrijven = Utilities
14. Bouw = Construction
15. Industrie = Industrial manufacturing
16. Landbouw = Agriculture
17. Delfstoffen = Quarrying
|
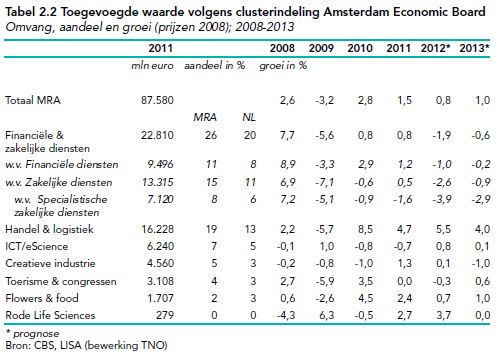
Sector Growth
|
The tale to the left shows the growth or decline of industry sectors as a percent of GRP by year since the Great Recession. Similar economic sectors in this table have been grouped into related "clusters" by the Amsterdam Economic Board.
From 2008-2013, Financial and Business Services dominated AMA's economy, bringing in 22,810,000 Euros in 2011. The column "mln euro" is the millions of euros this cluster represents in GDP in 2011. MRA is the Dutch abbreviation for AMA and "aandeel in %" is the percent share of this cluster in national GDP. The percentages (column "groei in%") represent the yearly cluster growth or decline. AMA's GRP accounts for |
Overall, growth in the AMA in the last 10 years has been supported mainly by the internationally oriented sectors; namely Wholesale, Transport and Storage, Financial Services, and Information and Communication. These sectors represent the AMA's worldwide comparative economic advantage. The 2011 GRP of the AMA was 87.6 billion euros, representing about 17% of the total Dutch gross domestic product. Its diversity of economic sectors has made the AMA's economy particularly resilient. he AMA is and will continue to be a powerhouse of the Dutch economy for the foreseeable future.
The AMA strives to attract companies to the region. Every year sees new developments that keep Amsterdam at the head of the international business pack. Read more about the sub-region specializations; world class ports; multinational headquarter and major business centers; and what makes the AMA a global business metro.
The AMA strives to attract companies to the region. Every year sees new developments that keep Amsterdam at the head of the international business pack. Read more about the sub-region specializations; world class ports; multinational headquarter and major business centers; and what makes the AMA a global business metro.
Facts and figures drawn primarily from :
SEO Economisch Onderzoek (2009(, "Amsterdam, Netherlands: Self-Evaluation Report", OECD Reviews of Higher Education in Regional and City Development, IMHE
"Economische Verkenningen Metropoolregio Amsterdam 2012"
SEO Economisch Onderzoek (2009(, "Amsterdam, Netherlands: Self-Evaluation Report", OECD Reviews of Higher Education in Regional and City Development, IMHE
"Economische Verkenningen Metropoolregio Amsterdam 2012"
